KIM HENG OFFSHORE & MARINE HOLDINGS LIMITED
ANNUAL REPORT 2014
20
),1$1&,$/ 3(5)250$1&( 5(9,(:
7KH*URXS¶V ¿QDQFLDO SHUIRUPDQFH LQ )< ZDV UHVLOLHQW
against a competitive and softening offshore and marine
sector. Revenue dipped by 8.1% y-o-y to S$78.0 million
in FY2014, from S$84.8 million in FY2013. This was a
result of lower revenue contribution from the ORS-SCM
VHJPHQW RIIVHW SDUWLDOO\ E\ KLJKHU UHYHQXH IRU WKH 96 1%
segment.
Singapore remained the largest market for the Group,
contributing S$45.6 million or 58.5% to the Group’s
revenue.
The Group’s total assets were S$130.0 million as at 31
December 2014, an increase of 41.4% y-o-y from the
previous year. Current assets were valued at S$66.8
million, an increase of S$32.6 million from 31 December
2013. This was primarily due to the increase in cash and
FDVK HTXLYDOHQWV RI 6 PLOOLRQ IURP WKH *URXS¶V ,32
on the Catalist board in January 2014 and collections
from customers during FY2014. Additionally, it was
supplemented by the increase in inventories of S$1.5
million.
OPERATIONS AND
FINANCIAL REVIEW
As at 31 December 2014, the Group’s total liabilities
decreased by 7.3% y-o-y to S$32.0 million. This was due
to a reversal of overprovision of tax in the previous year
which amounted to S$0.7 million, paired with a decrease
in current tax payable of S$2.4 million, as a result of lower
SUR¿WV IRU WKH ¿QDQFLDO \HDU
In FY2014, cost of sales increased by S$2.7 million,
primarily due to the higher cost incurred on vessel sales
DQG UHODWHG FRVW $V D UHVXOW WKH *URXS¶V JURVV SUR¿W
decreased by 26.0% y-o-y to S$27.0 million, from S$36.5
PLOOLRQ LQ OLQH ZLWK D GHFOLQH LQ JURVV SUR¿W PDUJLQ WR
IURP 7KH ORZHU JURVV SUR¿W PDUJLQ ZDV GXH
to a shift in revenue mix, with a drop in contribution from
the higher-margin ORS-SCM segment and an increase in
FRQWULEXWLRQ IURP WKH ORZHU PDUJLQ 96 1% VHJPHQW
7KH QHW SUR¿W IRU )< ZDV 6 PLOOLRQ FRPSDUHG WR
D QHW SUR¿W RI 6 PLOOLRQ LQ )<
STEADY OPERATING CASHFLOW, STRONG CASH
POSITIONAND SECURE OUTLOOK
Overall, net cash generated from operating activities
amounted to S$20.7 million, against S$20.2 million
in FY2013. Through prudent cash management and
proceeds from the IPO, the Group ended FY2014 with
FDVK DQG FDVK HTXLYDOHQWV DW 6 PLOOLRQ 0RUHRYHU
with a business direction in place, this strong cash
SRVLWLRQ DOORZV XV WKH ÀH[LELOLW\ WR FDSLWDOL]H RQ IDYRXUDEOH
DFTXLVLWLRQ DQG EXVLQHVV H[SDQVLRQ RSSRUWXQLWLHV
Going forward, the Group will be committed to its
aforementioned pre-emptive measures and growing its
ability to service larger and more complex vessels. Kim
+HQJ UHPDLQV FRQ¿GHQW WKDW LW KDV VXI¿FLHQW H[SHUWLVH D
wealth of knowledge and a strong management team that
will lead the Group to emerge stronger in FY2015.
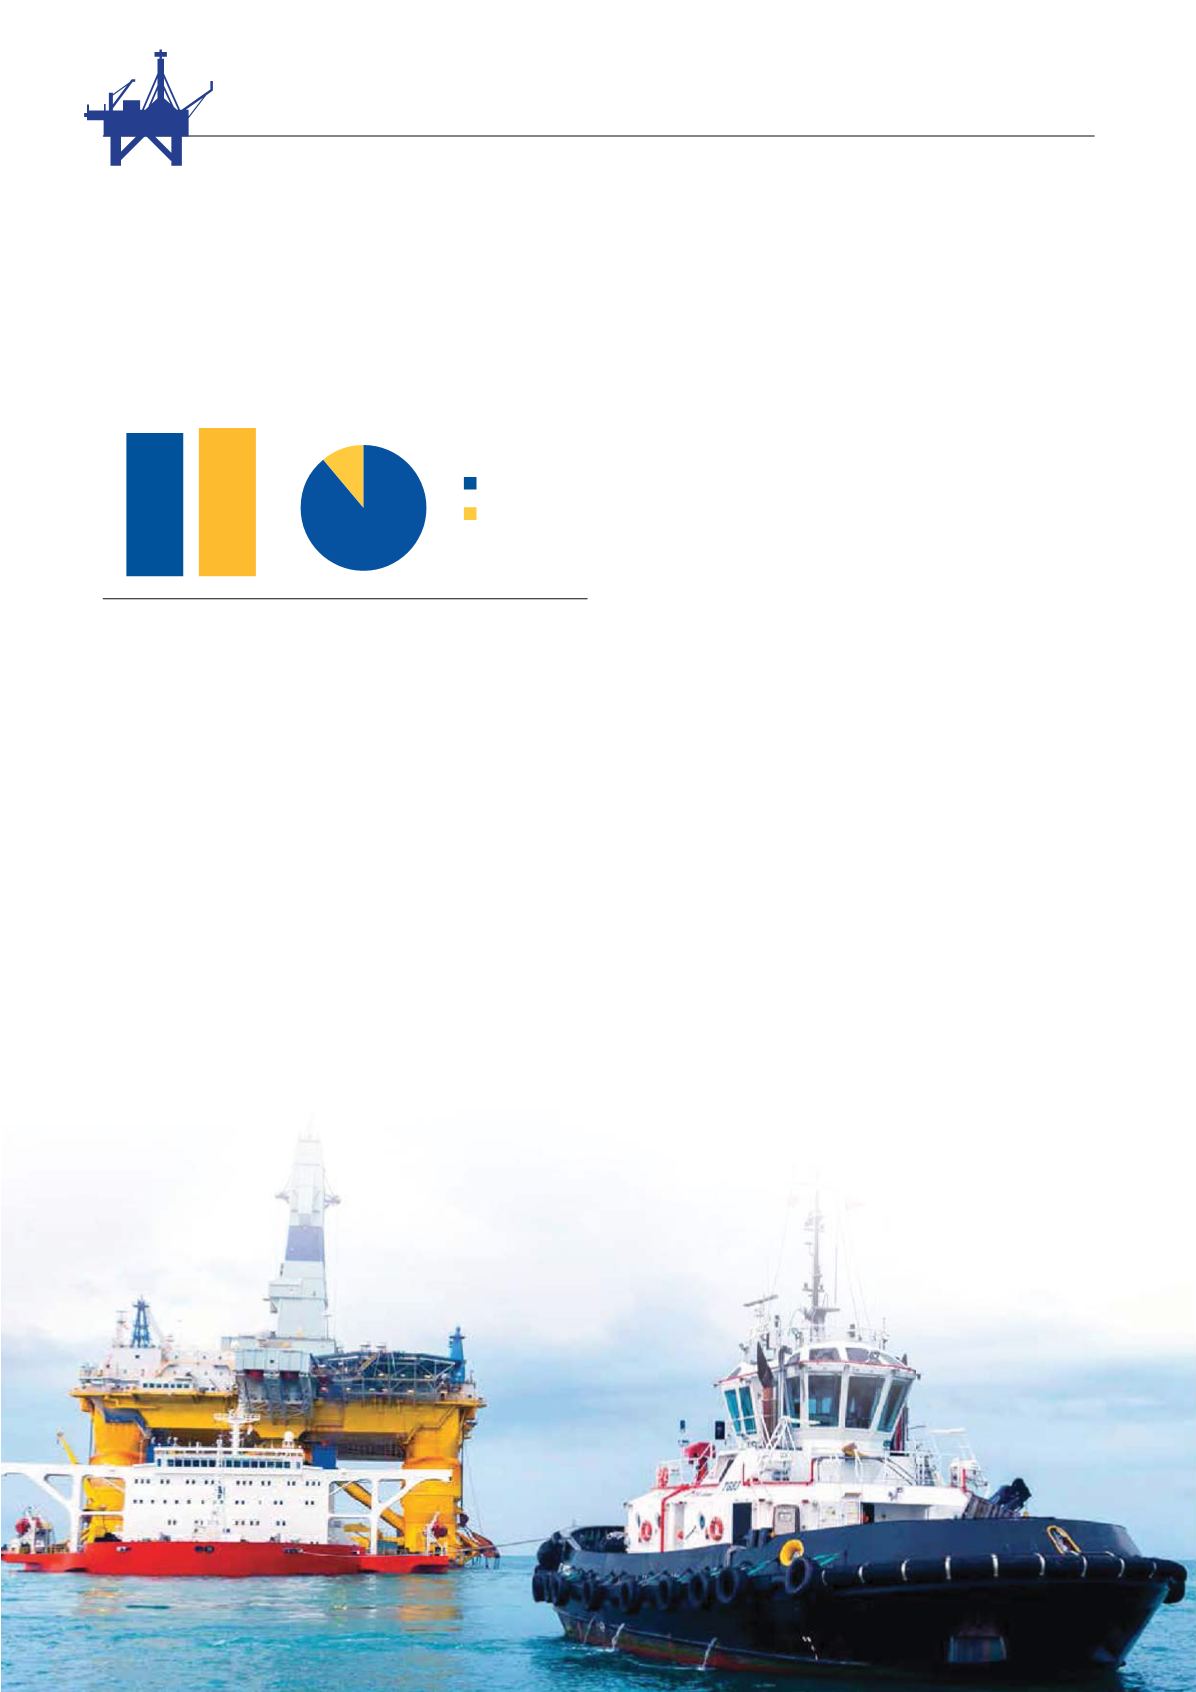
Number of Rigs Served
FY 2014 Segmented Revenue
2014
2013
68 70
69.3 89%
8.6 11%
$OO ¿JXUHV DUH LQ 6 ¶PLOOLRQ
96 1%
ORS-SCM


